Energy Budgeting Dashboard
A web-based dashboard that helps individuals aged 50+ visualize and manage their household energy and water consumption in relation to their financial expenditure.
Role:
User Research · UX/UI Design · Prototyping (Figma) · Evaluation · Academic Reporting
Project Overview
For the course Human-Computer Interaction and Information Visualization at Leiden University, I worked on a semester-long project called Energy Budgeting Dashboard. Together with my teammate, I designed and prototyped a web-based dashboard that helps individuals aged 50+ visualize and manage their household energy and water consumption in relation to their financial expenditure. The goal was to make energy monitoring simple, calming, and accessible for a demographic often overlooked by mainstream applications.
The Challenge
Existing energy management apps are typically mobile-first, feature-heavy, and difficult to navigate. They often neglect older adults, who may not have grown up with digital technologies and can feel overwhelmed by cluttered dashboards or fragmented systems (e.g., separate apps for gas, water, electricity, and smart devices). This creates frustration and alienation, leaving a gap in the market for an inclusive, intuitive solution.
The design challenge:
- How might we provide people aged 50+ with a clearer understanding of their household energy use?
- How can we combine energy and financial insights without overstimulation?
- What design strategies can reduce cognitive load and improve learnability for this demographic?
Research & Discovery
- Literature review: We drew on HCI and cognitive load theory to define usability requirements: simplicity, learnability, ease-of-use, and clear navigation.
- User analysis: Defined target group as adults 50+, moderately familiar with technology but preferring minimalistic interfaces. Pain points included fragmented apps, overstimulation, and difficulty finding meaningful insights.
- Benchmarking: Reviewed apps like Eneco, BudgetThuis, and GreenChoice, noting they lacked inclusivity and simplicity for older adults.
Key Insight: Older adults valued clarity and calmness over feature-rich complexity. The interface should feel welcoming, reduce friction, and empower them to make informed decisions about energy and costs.
Design & Development
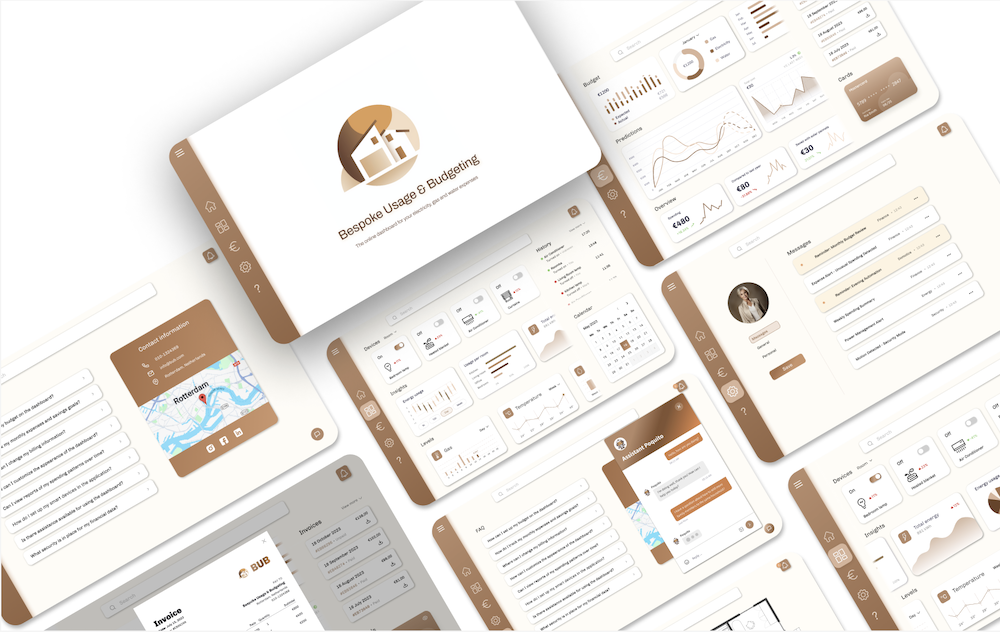
We designed the prototype entirely in Figma, starting from sketches and wireframes to a high-fidelity interactive dashboard. The interface followed a neutral, calming color scheme (beige, white, soft brown) and focused on an interactive floor plan where users could hover over rooms and appliances to see consumption and costs.
Core Features:
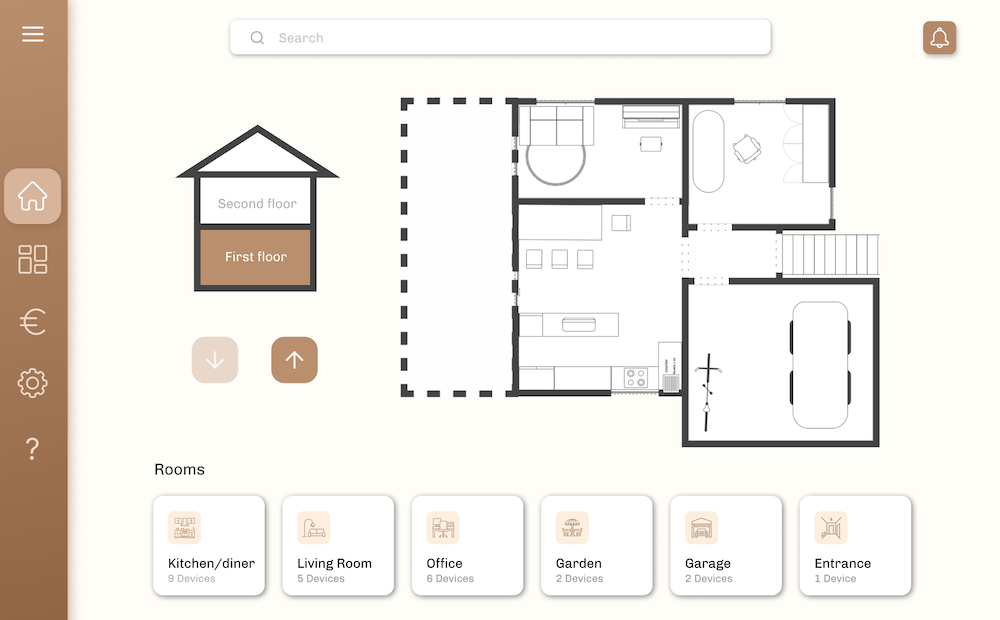
- Interactive Floor Plan: Semi bird's-eye view of the house, allowing users to navigate floors and rooms, and view appliance-specific usage.
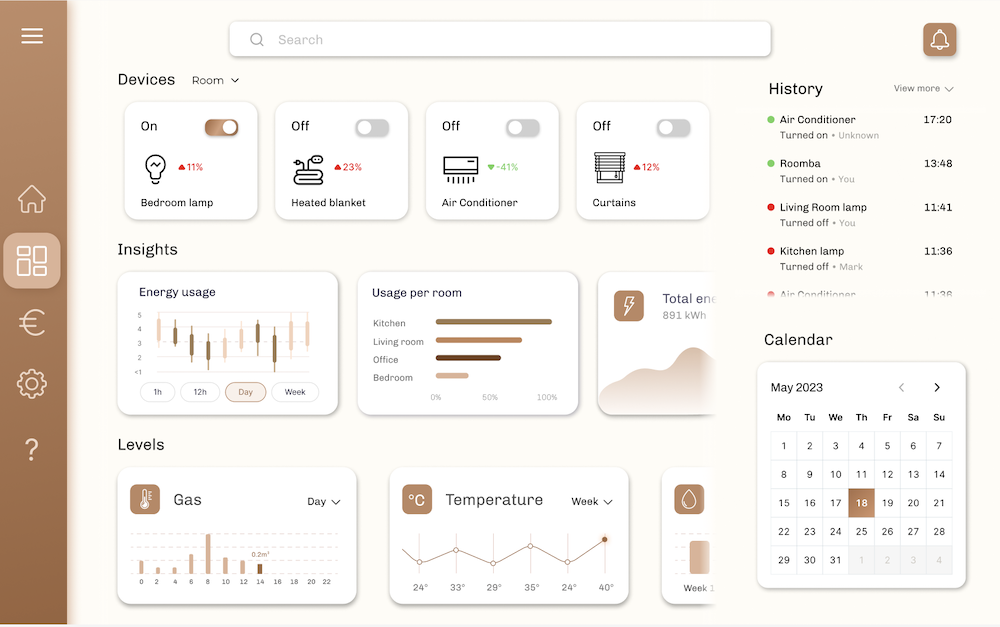
- Insights Page: Clear graphs and widgets showing gas, water, and electricity use over time.
- Finance Section: Integrated budgeting data linked to consumption, offering transparency on costs.
- Help & Settings: Split into separate sections after user feedback, including FAQs and a chatbot assistant for easy support.
- Calming Visual Design: Neutral tones, large icons, and clear navigation to reduce cognitive overload.
Wireframes & Prototypes
Below are screens from the design process.
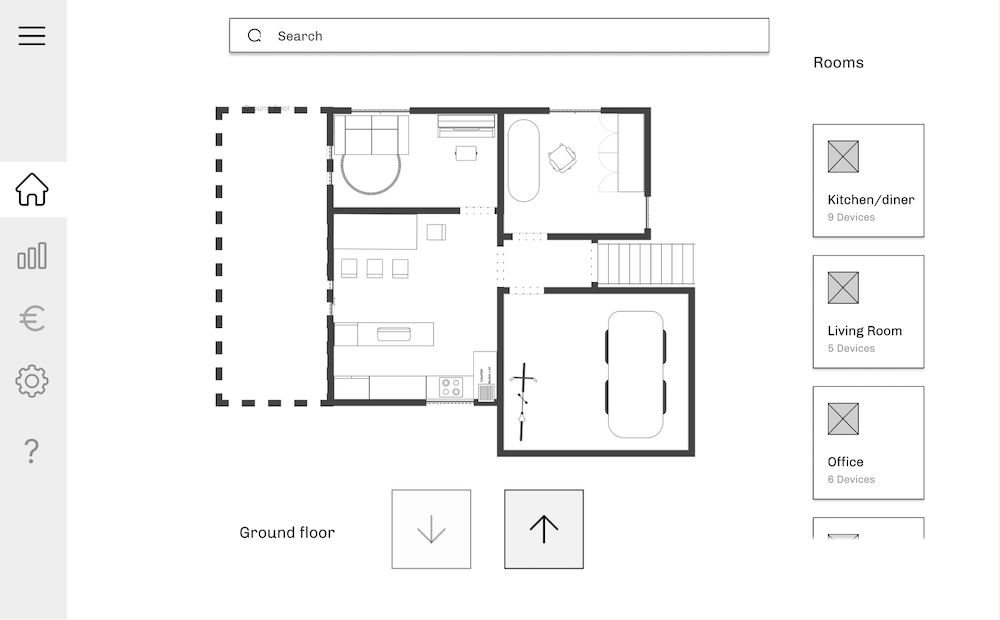
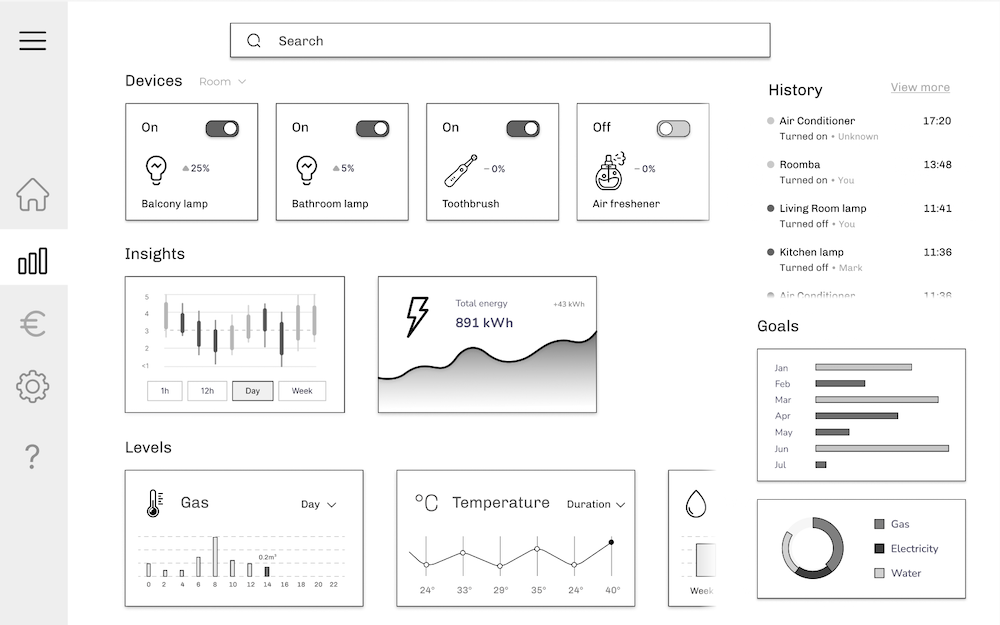
Early wireframes illustrating layout and navigation and the matching high‑fidelity prototype screens after user evaluation.
Evaluation
We ran two rounds of user evaluations with participants in the target age group. Tasks tested navigation, simplicity, learnability, and ease of use. Feedback was collected via task performance, SUS questionnaires, and open-ended interviews.
Findings:
- Users appreciated the floor plan and calming design, but suggested more clickable elements and better color coding.
- The initial merge of Help and Settings was confusing, leading us to separate them.
- SUS results showed improved confidence in navigation and learnability across iterations, though some found the second version slightly more complex.
- Participants agreed they would use the application frequently if available, reporting that it made them feel confident and in control.
The Solution
The final prototype included:
- Home: Interactive floor plan of household devices and rooms.
- Insights: Charts and widgets summarizing usage of water, gas, and electricity.
- Finance: Integration of budgeting with resource use.
- Help: FAQs, chatbot, and contact info.
- Settings: Notifications, personalization, and accessibility options.
This design simplified household energy visualization for older adults, making it easier to understand and act on resource consumption while reducing cognitive load.
Impact & Learnings
- Academic impact: The project demonstrated how HCI and visualization principles can support inclusive design for older adults.
- User impact: Older adults responded positively, reporting increased confidence and willingness to use such a tool.
- Personal learnings: I gained experience translating theory into practice, designing for inclusivity, and conducting iterative user evaluations. Most importantly, I learned how design decisions (color, navigation, iconography) can directly influence confidence and usability for non-digital natives.
Results
Explore the interactive prototype: